#WCTCAI梗图挑战
🔥 WCTC S8 Meme Contest — When Crypto Dreams Meet Market Reality 😭📉
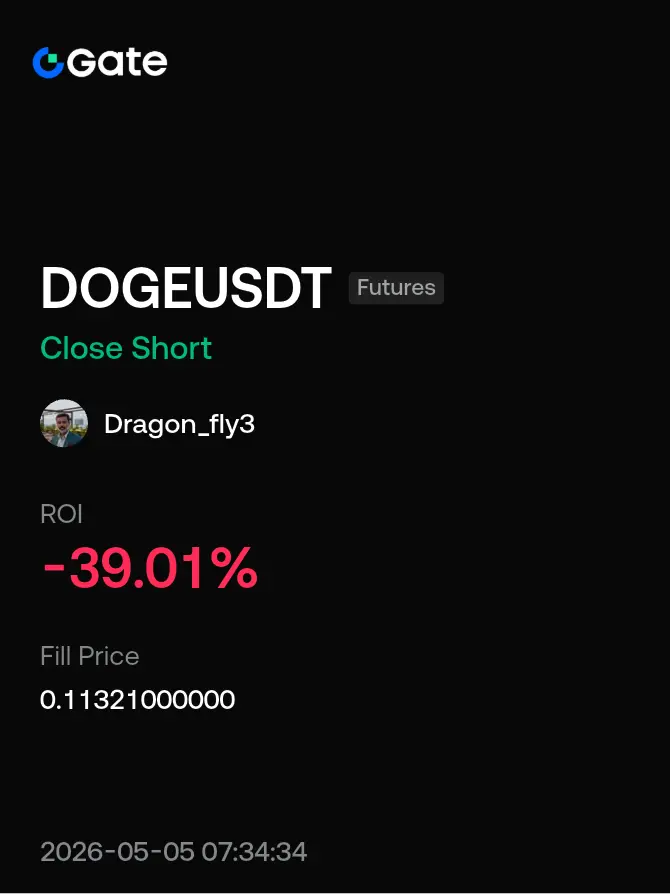
“When you buy the dip in crypto… and the market politely creates another dip just to test your confidence again.”
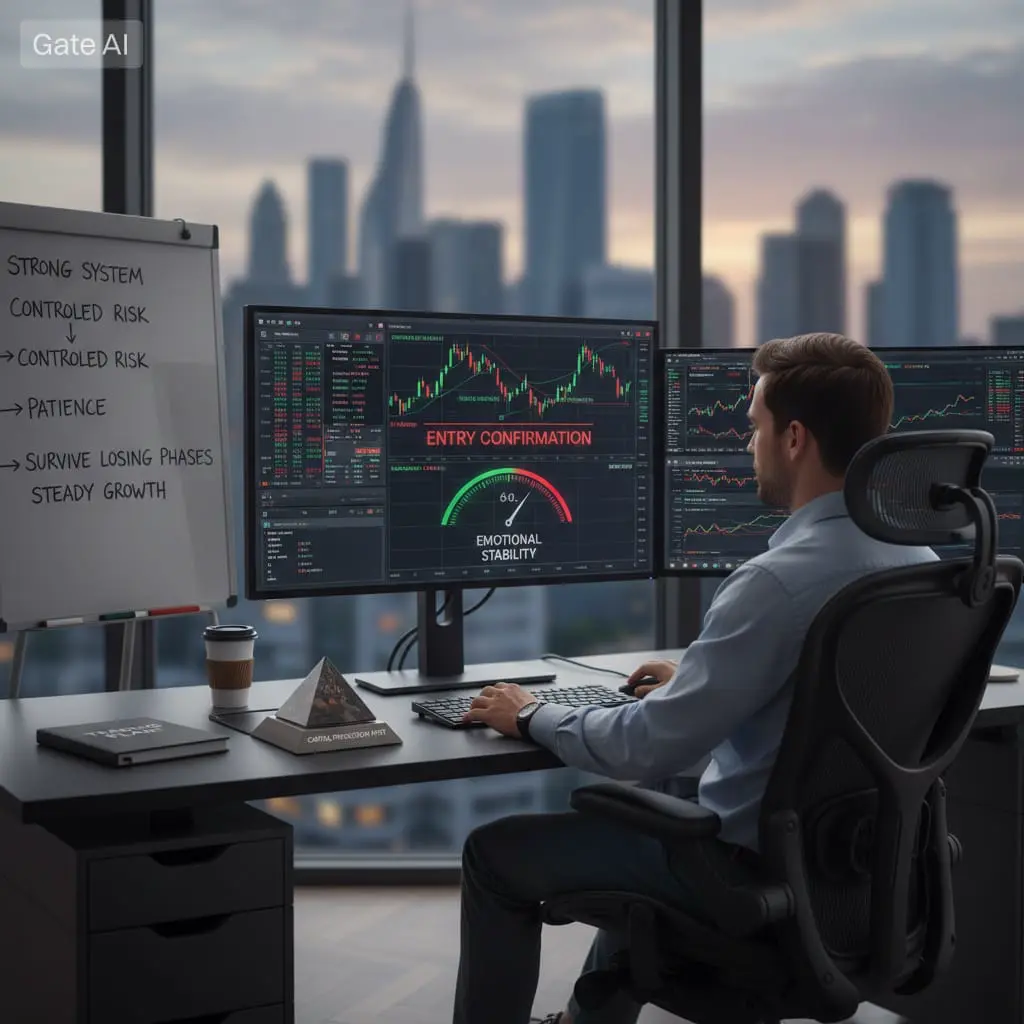
Crypto trading is not just numbers on a chart or green and red candles moving randomly on a screen. It is an emotional journey where every decision feels correct in the moment, but the market often responds in a completely unexpected direction. Traders enter with optimism, believing they have identified the perfect entry point, but the market constantly reminds everyone that timing in crypto is one of the hardest skills to master.
In many situations, Bitcoin approaches a strong support zone, sentiment starts improving, social media turns bullish, and everyone begins talking about recovery. Traders feel confident,
expecting momentum to continue upward. Positions are opened, leverage is sometimes increased, and hope builds around the idea that “this is the bottom.” But instead of confirming that belief, the market often enters another liquidity sweep, pushing price lower, triggering stop losses, and creating emotional pressure for retail traders.
This cycle repeats again and again across different coins and timeframes. Ethereum shows strength, then consolidates. Altcoins pump aggressively, then correct even harder. What looks like a breakout often turns into a fake move designed to trap late entries. This is not manipulation in a simple sense, but rather the natural structure of liquidity-driven markets where big players operate around clusters of stop losses and emotional trading behavior.
Every trader eventually experiences this phase where confidence turns into confusion, and strategy is tested by volatility. The real challenge is not just predicting direction, but surviving the unpredictable nature of price movement. Markets are designed to move in waves, not straight lines, and those waves often feel personal when positions are involved.
Experienced traders slowly learn that emotional reactions lead to repeated losses. Instead of chasing every dip or breakout, they wait for confirmation, manage risk carefully, and accept that not every opportunity needs to be traded. Patience becomes a hidden edge in a market where speed often leads to mistakes.
Risk management becomes more important than prediction. Position sizing, stop-loss discipline, and capital preservation matter more than trying to catch every move. A trader who survives multiple cycles has a much higher chance of long-term success compared to someone who wins once but loses everything in the next overconfident trade.
In reality, crypto trading is a psychological game disguised as a financial market. Charts are just reflections of human behavior—fear, greed, hope, and panic. Understanding this emotional structure is what separates consistent traders from emotional ones.
That is why moments like this meme represent every trader’s journey: entering with confidence, facing unexpected continuation of downside, and learning slowly that the market rewards discipline more than excitement.
Even when the market feels unfair, it continues to offer opportunities every single day. The key is not to fight it emotionally, but to align with it strategically. Because in the end, survival is the first step toward profitability in crypto trading.
🏷️ Hashtags:
#WCTCAI梗图挑战
🔥 WCTC S8 Meme Contest — When Crypto Dreams Meet Market Reality 😭📉
“When you buy the dip in crypto… and the market politely creates another dip just to test your confidence again.”
Crypto trading is not just numbers on a chart or green and red candles moving randomly on a screen. It is an emotional journey where every decision feels correct in the moment, but the market often responds in a completely unexpected direction. Traders enter with optimism, believing they have identified the perfect entry point, but the market constantly reminds everyone that timing in crypto is one of the hardest skills to master.
In many situations, Bitcoin approaches a strong support zone, sentiment starts improving, social media turns bullish, and everyone begins talking about recovery. Traders feel confident,
expecting momentum to continue upward. Positions are opened, leverage is sometimes increased, and hope builds around the idea that “this is the bottom.” But instead of confirming that belief, the market often enters another liquidity sweep, pushing price lower, triggering stop losses, and creating emotional pressure for retail traders.
This cycle repeats again and again across different coins and timeframes. Ethereum shows strength, then consolidates. Altcoins pump aggressively, then correct even harder. What looks like a breakout often turns into a fake move designed to trap late entries. This is not manipulation in a simple sense, but rather the natural structure of liquidity-driven markets where big players operate around clusters of stop losses and emotional trading behavior.
Every trader eventually experiences this phase where confidence turns into confusion, and strategy is tested by volatility. The real challenge is not just predicting direction, but surviving the unpredictable nature of price movement. Markets are designed to move in waves, not straight lines, and those waves often feel personal when positions are involved.
Experienced traders slowly learn that emotional reactions lead to repeated losses. Instead of chasing every dip or breakout, they wait for confirmation, manage risk carefully, and accept that not every opportunity needs to be traded. Patience becomes a hidden edge in a market where speed often leads to mistakes.
Risk management becomes more important than prediction. Position sizing, stop-loss discipline, and capital preservation matter more than trying to catch every move. A trader who survives multiple cycles has a much higher chance of long-term success compared to someone who wins once but loses everything in the next overconfident trade.
In reality, crypto trading is a psychological game disguised as a financial market. Charts are just reflections of human behavior—fear, greed, hope, and panic. Understanding this emotional structure is what separates consistent traders from emotional ones.
That is why moments like this meme represent every trader’s journey: entering with confidence, facing unexpected continuation of downside, and learning slowly that the market rewards discipline more than excitement.
Even when the market feels unfair, it continues to offer opportunities every single day. The key is not to fight it emotionally, but to align with it strategically. Because in the end, survival is the first step toward profitability in crypto trading.
🏷️ Hashtags:
#WCTCAI梗图挑战