#BTCBreaks82000
Bitcoin has officially moved back above the important $80,000 level, and the crypto market is becoming bullish again. After months of corrections and fear in the market, BTC is now trading around $81K and showing strong recovery momentum.
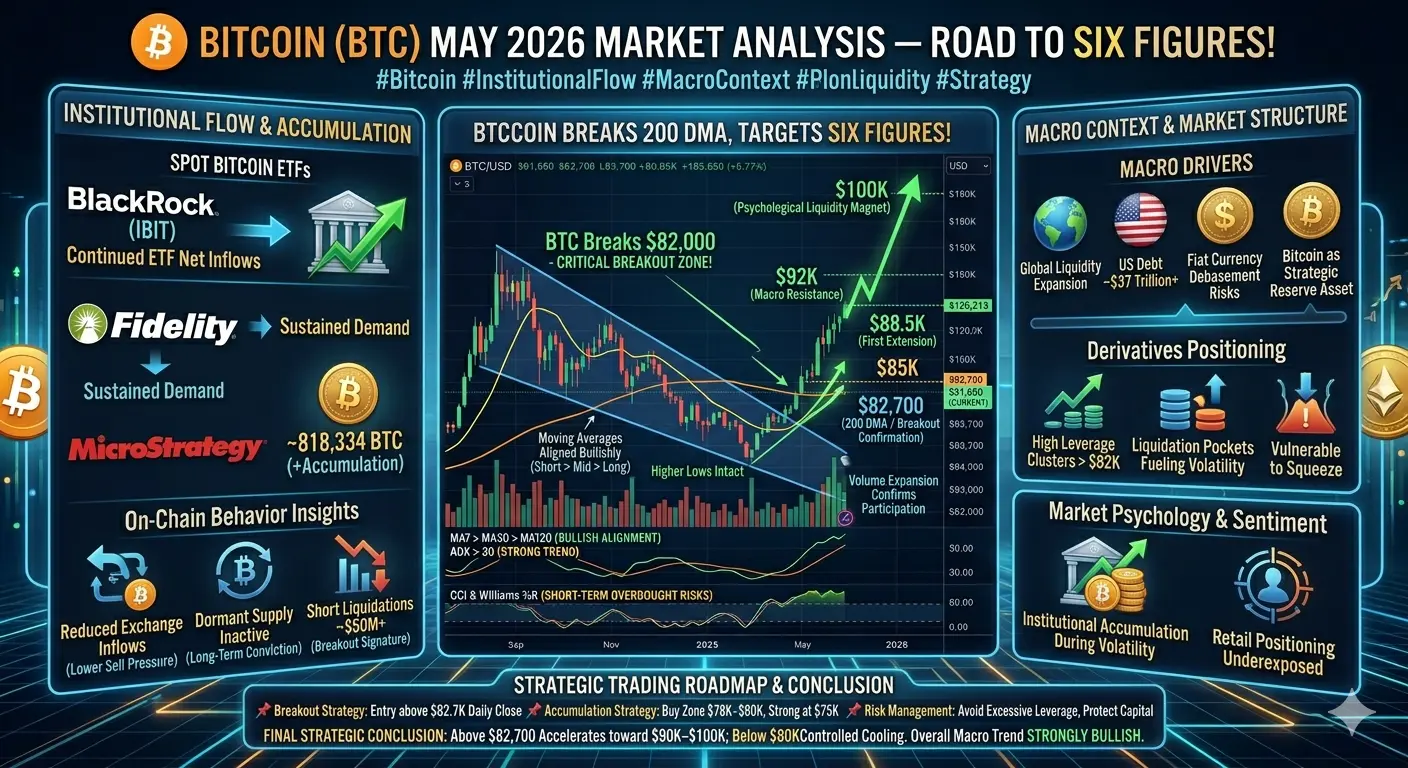
Earlier this year, Bitcoin dropped heavily from its 2025 all-time high above $126K. The market saw panic selling, weak sentiment, and uncertainty because of inflation concerns, Federal Reserve pressure, and global geopolitical tensions. BTC even fell close to the $68K–$70K zone during the correction.
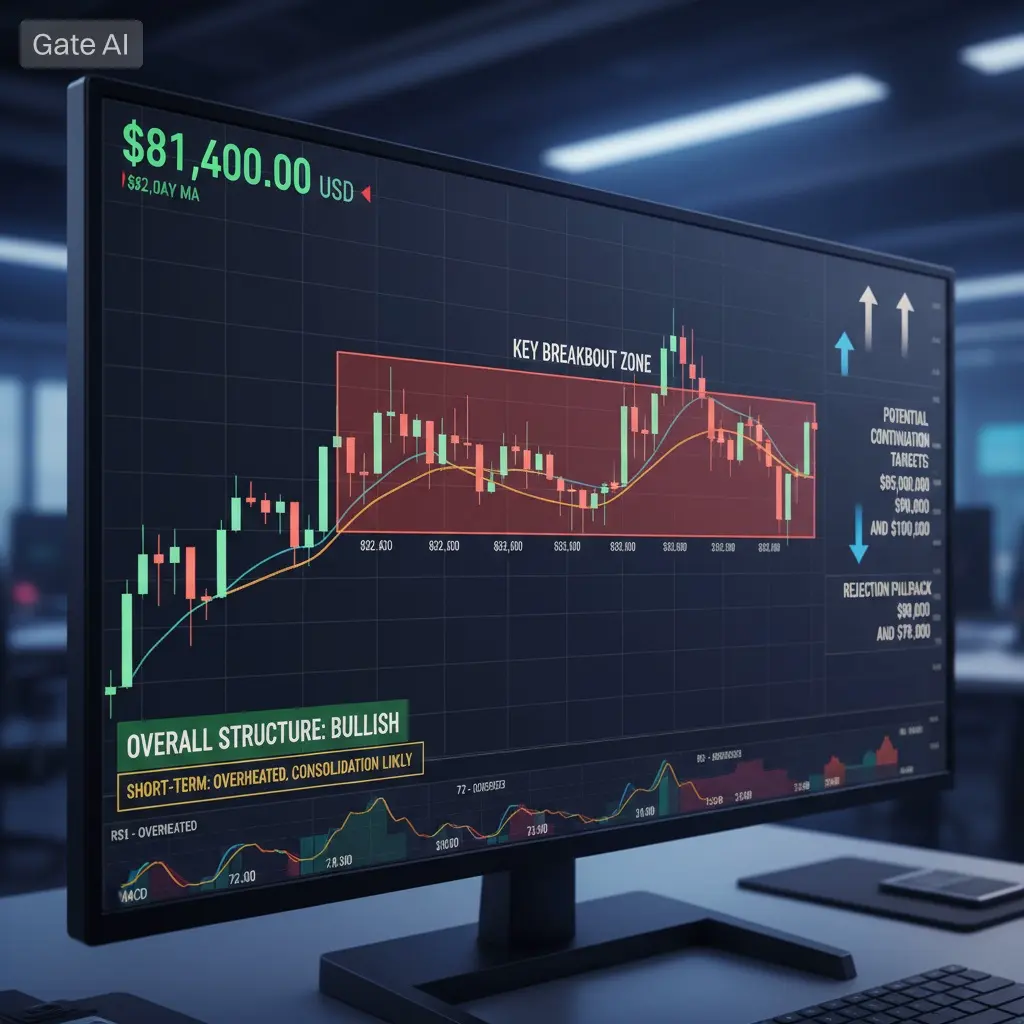
Now the situation is starting to change. Bitcoin has recovered strongly from those lows, and buyers are returning to the market. Breaking above $80K is important because this level acted as a major resistance for many months. The breakout has improved trader confidence and brought fresh momentum into crypto.
One of the biggest reasons behind Bitcoin’s strength is institutional demand. Spot Bitcoin ETFs continue attracting billions of dollars, while large investors and whale wallets are still accumulating during market weakness. Unlike older crypto cycles driven mostly by retail traders, this cycle has strong institutional support helping stabilize the market.
Global market conditions are also improving. Investors are expecting slower monetary tightening and better liquidity conditions in the coming months. Historically, Bitcoin performs well when liquidity improves and investors become more comfortable taking risks again.
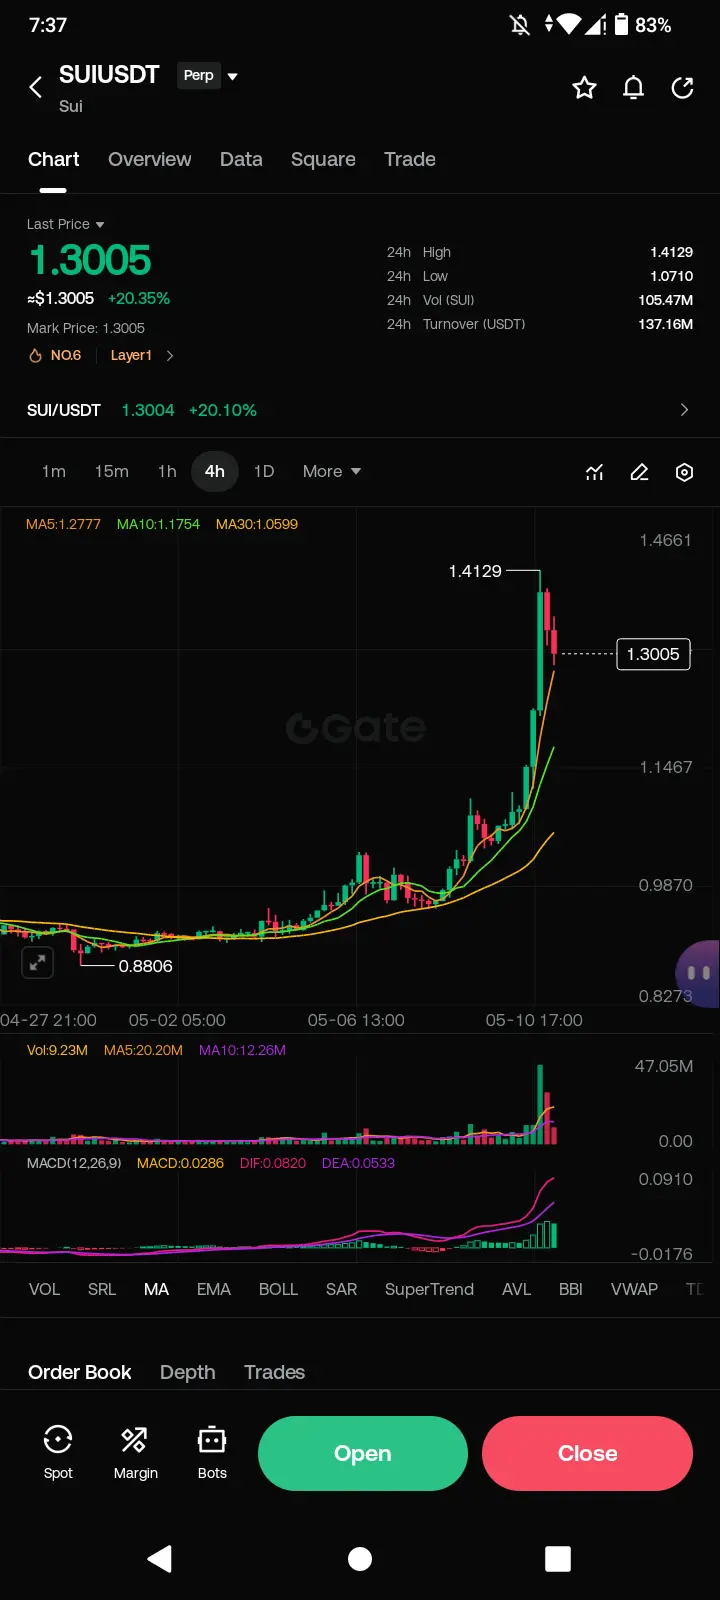
The broader crypto market is also reacting positively. Ethereum, Solana, AI tokens, and DeFi projects are all seeing stronger activity as market confidence returns. Bitcoin dominance remains strong near 60%, but capital is slowly rotating into altcoins as well.
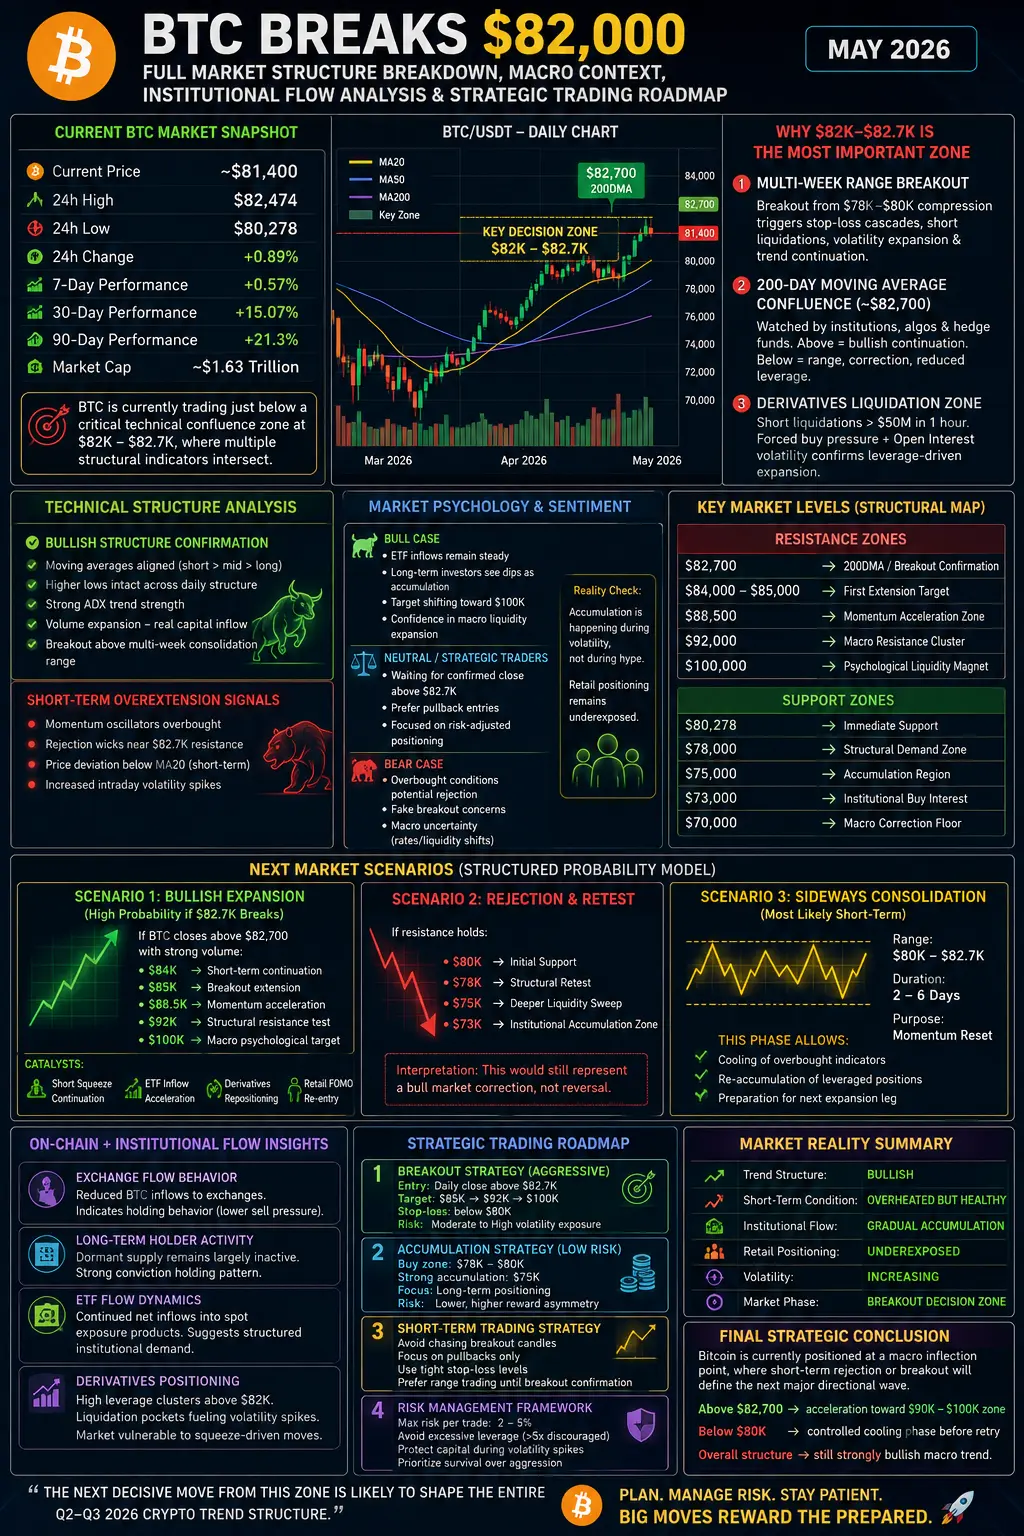
Technically, Bitcoin now needs to hold above the $80K region to maintain bullish momentum. Important resistance levels ahead are:
$82K → $85K → $90K → eventually $100K.
Key support zones remain:
$80K → $77K → $75K → $70K.
If BTC continues holding above support with strong volume, many traders believe the market could move toward new highs later in 2026. However, volatility is still high, and risks like geopolitical tensions, inflation surprises, or ETF outflows could still create sharp pullbacks.
Right now, market sentiment is improving again. Fear is slowly turning into optimism, and many investors believe Bitcoin may be entering the next expansion phase of the cycle.
For now, reclaiming $80,000 is more than just a price move — it signals renewed confidence, stronger demand, and growing bullish momentum across the entire crypto market.
#Gate13thAnniversaryLive
#GateSquareMayTradingShare
Bitcoin has officially moved back above the important $80,000 level, and the crypto market is becoming bullish again. After months of corrections and fear in the market, BTC is now trading around $81K and showing strong recovery momentum.
Earlier this year, Bitcoin dropped heavily from its 2025 all-time high above $126K. The market saw panic selling, weak sentiment, and uncertainty because of inflation concerns, Federal Reserve pressure, and global geopolitical tensions. BTC even fell close to the $68K–$70K zone during the correction.
Now the situation is starting to change. Bitcoin has recovered strongly from those lows, and buyers are returning to the market. Breaking above $80K is important because this level acted as a major resistance for many months. The breakout has improved trader confidence and brought fresh momentum into crypto.
One of the biggest reasons behind Bitcoin’s strength is institutional demand. Spot Bitcoin ETFs continue attracting billions of dollars, while large investors and whale wallets are still accumulating during market weakness. Unlike older crypto cycles driven mostly by retail traders, this cycle has strong institutional support helping stabilize the market.
Global market conditions are also improving. Investors are expecting slower monetary tightening and better liquidity conditions in the coming months. Historically, Bitcoin performs well when liquidity improves and investors become more comfortable taking risks again.
The broader crypto market is also reacting positively. Ethereum, Solana, AI tokens, and DeFi projects are all seeing stronger activity as market confidence returns. Bitcoin dominance remains strong near 60%, but capital is slowly rotating into altcoins as well.
Technically, Bitcoin now needs to hold above the $80K region to maintain bullish momentum. Important resistance levels ahead are:
$82K → $85K → $90K → eventually $100K.
Key support zones remain:
$80K → $77K → $75K → $70K.
If BTC continues holding above support with strong volume, many traders believe the market could move toward new highs later in 2026. However, volatility is still high, and risks like geopolitical tensions, inflation surprises, or ETF outflows could still create sharp pullbacks.
Right now, market sentiment is improving again. Fear is slowly turning into optimism, and many investors believe Bitcoin may be entering the next expansion phase of the cycle.
For now, reclaiming $80,000 is more than just a price move — it signals renewed confidence, stronger demand, and growing bullish momentum across the entire crypto market.
#Gate13thAnniversaryLive
#GateSquareMayTradingShare